Projects
Tree Canopy Cover in Los Angeles
As part of my team's project at NASA DEVELOP, I focused on creating a supervised classification model to calculate tree canopy cover using remote sensing. We used 1/2 m aerial imagery across four years to detect change in tree canopy cover for urban areas in Los Angeles County. We partnered with the City of Los Angeles, Office of City Forest Management and City Plants, and the inset map highlights a 2016 tree planting initiative along Vermont Avenue by our partners. For more information, see our final report, final presentation, and project poster.
Skills developed:
■ Google Earth Engine
■ ArcGIS Pro
■ Data visualization and communication
■ Working with end users and developing a project design

Urban Forest Management Plans
During my time at TreePeople, I had the opportunity to create Urban Forest Management Plans for the City of Paramount, San Fernando, and Huntington Park in Southern California. As the principal mapmaker and data analyst, I played a pivotal role in shaping these plans, meticulously crafting all the maps and charts that adorned the final reports
Skills developed:
■ ArcGIS Pro
■ Adobe Illustrator and InDesign
■ Data visualization and communication
■ Strong teamwork and communication abilities


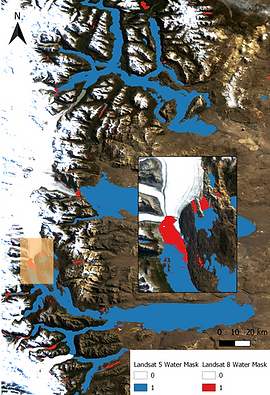
Dynamic Ice-Water Boundaries of the Greenland Ice Sheet
I produced a visually engaging cartographic representation of my research findings that effectively illustrates the dynamic spatial and temporal changes in the interaction between the Greenland Ice Sheet and water. The research project was published in the Journal of Glaciology by Cambridge University Press.
Skills developed:
■ Adobe Illustrator and Photoshop
■ Cartographic principles
■ Data management and organization
■ Data visualization and communication

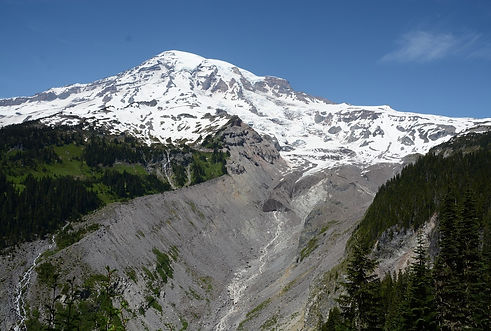
Stream Discharge Prediction
A team coding project using Python and GitHub to analyze discharge levels of the Nisqually River in Washington. We set out to understand what the most influential climate factors are for determining discharge levels in the study region.
Skills developed:
■ Python analysis of USGS gage data
■ Machine learning models
■ Stream discharge data
■ Climate data
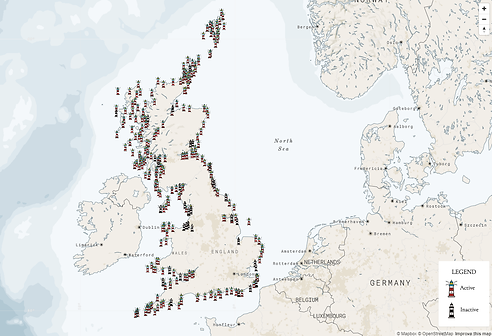
Lighthouses of Great Britain
An interactive web map built with Mapbox GL JS to display all locations of lighthouses in Great Britain and include relevant information/statistics along with an image of each lighthouse.
Skills developed:
■ HTML and CSS coding experience
■ Mapbox API experience
■ Publishing a website on a server
Chemical Uncertainty: How to Regulate the Ever-Expanding Group of PFAS in Our Nation’s Waterbodies
A research paper that analyzes the current regulating policies around per- and polyfluoroalkyl substances and suggests strengthening regulating measures of the chemicals at the federal level.
Skills developed:
■ Public policy research and exposure
■ Research skills
■ Science writing growth

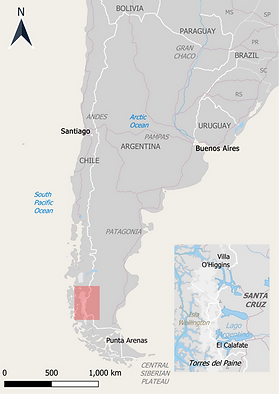
Visualizing NDWI Change for Glacial Lakes in the Patagonia Mountains
Using Google Earth Engine and Landsat imagery, I created cloud free image mosaics for 2001 and 2021, calculated NDWI, and visualized NDWI difference between time periods.
Skills developed:
■ Google Earth Engine, JavaScript
■ QGIS analysis and data visualization
The Effects of Increasing Urbanization Rates on the Environment
A research paper that examines the process of urbanization and its impacts on the environment at a national scale (India) and a local scale (Delhi, India).
Skills developed:
■ Research and analytical skills
■ Climate report analysis and data collection

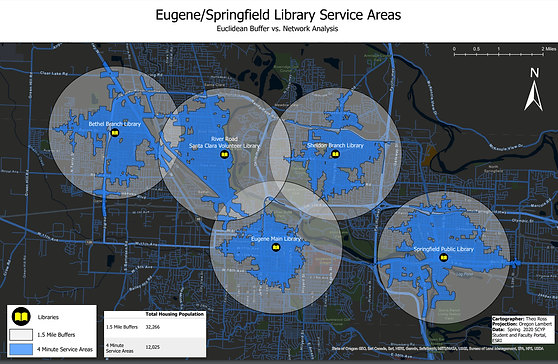
Eugene/Springfield Library Service Areas
I used ArcGIS Pro to create network service areas of public libraries in Eugene, Oregon using road networks and Euclidean buffers. I then created a figure comparing zonal statistics of the service areas using Euclidean buffers to the service areas using road networks.
Skills developed:
■ ArcGIS Pro analysis
■ Figure design and data presentation